

Q4FY25 Consolidated ROA at 1.88%, Consolidated ROE at 17.11%, PAT at `7,117 crores up 13% QOQ, aided by CASA growth of 10% QOQ and total deposits growth of 7% QOQ
*Bank’s focus segments include Small Business Banking (SBB), Small & Medium Enterprises (SME), Mid Corporate, Rural, Personal Loans (PL) and Credit Card Advances
QAB : Quarterly Average Balance;
MEB: Month End Balance; MAU: Monthly Active Users engaging in financial & non-financial transactions;
1 SBB : Small Business Banking;
2 Based on RBI data as of Feb’25;
3 Coverage Ratio = Aggregate provisions (specific + standard + additional + other contingencies) / IRAC GNPA;
^ Net accretion = capital accreted – capital consumed

Snapshot (As on March 31st, 2025) (in ` Crores)
| Profit & Loss | Absolute (in ` Crores) | QOQ | YOY Growth | |||
|---|---|---|---|---|---|---|
| Q4FY25 | Q3FY25 | FY25 | Q4FY25 | Q4FY25 | FY25 | |
| Net Interest Income | 13,811 | 13,606 | 54,348 | 2% | 6% | 9% |
| Fee Income | 6,338 | 5,455 | 22,504 | 16% | 12% | 11% |
| Operating Expenses | 9,838 | 9,044 | 37,500 | 9% | 6% | 6% |
| Operating Profit | 10,752 | 10,534 | 42,105 | 2% | 2% | 13% |
| Core Operating Profit | 10,575 | 10,102 | 39,916 | 5% | 11% | 13% |
| Profit after Tax | 7,117 | 6,304 | 26,373 | 13% | - | 6% |
| Balance Sheet | Absolute (in ` Crores) | YOY Growth |
|---|---|---|
| As on 31.3.2025 | ||
| Total Assets | 16,09,930 | 9% |
| Net Advances | 10,40,811 | 8% |
| Total Deposits | 11,72,952 | 10% |
| Shareholders' Funds | 1,78,617 | 19% |
| Key Ratios | Absolute (in ` Crores) | |
|---|---|---|
| Q4FY25 / FY25 | Q4FY24 / FY24 | |
| Diluted EPS (Annualised in `) | 92.73 / 84.77 | 92.34 / 80.10 |
| Book Value per share (in `) | 577 | 487 |
| Standalone ROA (Annualised %) | 1.83 / 1.74 | 2.00 / 1.83 |
| Standalone ROE (Annualised %) | 16.98 / 16.52 | 20.35 / 18.86 |
| Cons ROA (Annualised %) | 1.88 / 1.77 | 2.07 / 1.84 |
| Cons ROE (Annualised %) | 17.11 / 16.89 | 20.87 / 19.29 |
| Gross NPA Ratio | 1.28% | 1.43% |
| Net NPA Ratio | 0.33% | 0.31% |
| Basel III Tier I CAR(c) | 15.07% | 14.20% |
| Basel III Total CAR(c) | 17.07% | 16.63% |
(c) including profit after tax for FY25
 10% YOY (a) 9% YOY (b)
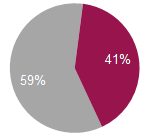
 CASA
CASA
4% YOY (a) | 3% YOY (b)
(a) Period end balances (b) Quarterly average balance
8% YOY 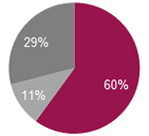 Retail
 SME
SME
 Corporate
7% YOY | 14% YOY | 8% YOY
5% QOQ 13% YOY 13% QOQ 6% YOY 


Healthy core operating performance

Focus on average deposits continues, MEB deposit growth robust in Q4FY25
SBB+SME+MC growth remains healthy
Well capitalized with self-sustaining capital structure; adequate liquidity buffers
Continue to maintain our strong position in Payments and Digital Banking
Stable asset quality, lowest net NPA amongst large private sector banks
Key domestic subsidiaries7 delivered strong performance
1 MEB : Month End Balance, QAB: Quarterly Average Balance
2 Liquidity Coverage Ratio
3 with 3 mn+ reviews
^ Net accretion = capital accreted – capital consumed during the quarter
4 Monthly active users, engaging in financial and non-financial transactions
5 (specific+ standard+ additional + other contingencies) / IRAC GNPA
6 Annualized
7 Figures of subsidiaries are as per Indian GAAP, as used for consolidated financial statements of the Group