• Q1 FY25
  • Quarter-1 Results 2024-25

Major Highlights of

Q1FY25

Q1FY25 core operating profit of `9,637 crores up 16% YOY, NIM at 4.05%, cost growth moderating, aided by steady growth in average deposits and advances

Steady core operating performance

  • Net Interest Income grew 12% YOY and 3% QOQ, Net Interest Margin at 4.05%
  • Fee income grew 16% YOY, granular fee constituted 93% of overall fees, Retail fee grew 18% YOY
  • Core Operating revenue up 14% YOY, Operating cost growth moderated to 11% YOY & declined sequentially, Q1FY25 Net profit at `6,035 crores, up 4% YOY
  • Consolidated ROA | ROE on annualized basis at 1.70% | 16.68%, with subsidiaries contributing 5 bps | 42 bps, respectively

QAB deposits grew sequentially, CASA ratio on MEB basis stood at 42%

  • On QAB basis, total deposits grew 14% | 3%; term deposits grew 21% | 4%, CA grew 8%| 2%, SA grew 3% | 3% on YOY | QOQ basis, respectively
  • On MEB basis, total deposits grew 13% YOY, term deposits grew 20% YOY, CA grew 12% YOY, SA stood flat YOY
  • CASA ratio on MEB basis stood at ~42%, which is amongst the best for peer private banks
  • Avg. LCR Outflow rates improved by ~400 bps in last 2 years

Loan growth delivered across focus business segments

  • Advances grew 14% YOY and 2% QOQ; Bank’s focus segments* grew by 24% YOY and 1% QOQ
  • Retail loans grew 18% YOY of which Rural loans grew 24% YOY, SBB1 book grew 26% YOY and 2% QOQ
  • Corporate loans (gross of IBPC sold) up 10% YOY and 4% QOQ, Mid-Corporate (MC) up 24% YOY & 2% QOQ, SME loans up 20% YOY
  • SBB+SME+MC mix at ₹2,100 bn | 21% of total loans, up ~800 bps in last 4 years

Well capitalized with self-sustaining capital structure; adequate liquidity buffers

  • Self sustaining capital structure with net accretion^ to CET-1 of 32 bps in Q1FY25
  • Overall capital adequacy ratio (CAR) stood at 16.65% with CET 1 ratio of 14.06%
  • `5,012 crores of other provisions, not considered for CAR calculation, provides cushion of 40 bps over the reported CAR
  • Excess SLR of `77,244 crores. Avg. LCR during Q1FY25 was ~120%,

Continue to maintain strong position in Payments and Digital Banking

  • Largest player in Merchant Acquiring business in India with terminal market share of ~21%, incremental share of ~45% in last one year 2
  • ~1 million credit cards acquired in Q1FY25, CIF market share of ~14% 2
  • Axis Mobile app is among the top rated mobile banking app on Google Play with ratings of 4.8 and ~14 million MAU
  • 410+ APIs hosted on Bank’s API Developer Portal with 285+ Retail APIs

Asset quality stable, credit costs higher due to seasonality and lower recoveries and upgrades, not indicative of full year credit costs

  • GNPA at 1.54% declined by 42 bps YOY, NNPA at 0.34% declined 7 bps YOY
  • PCR healthy at 78%, Coverage3 ratio at 150%,
  • Gross slippage ratio (annualized) at 1.97%, Net slippage ratio (annualized) at 1.37%
  • Q1FY25 annualized net credit cost at 0.97%

Key subsidiaries continue to deliver steady performance

  • Total Q1FY25 PAT of domestic subsidiaries at `436 crores, up 47% YOY; Return on investments of 54% in domestic subsidiaries
  • Axis Finance Q1FY25 PAT up 26% YOY, ROE at 14.7%, total CAR healthy at 19.4%, asset quality metrics improve with GNPA declining 10 bps YOY to 0.55%
  • Axis AMC’s Q1FY25 PAT up 27% YOY, Axis Securities Q1FY25 PAT up 171% YOY
  • Axis Capital Q1FY25 PAT up 220% YOY and executed 22 investment banking deals in Q1FY25

Citi integration completed successfully in July 2024

*Bank’s focus segments include Small Business Banking (SBB), Small & Medium Enterprises, (SME), Mid Corporate, Rural, Personal Loans (PL) and Credit Card Advances QAB: Quarterly Average Balance; MEB: Month End Balance; MAU: Monthly Active Users engaging in financial & non-financial transactions;
1 SBB : Small Business Banking;
2 Based on RBI data as of May’24;
3 Coverage Ratio = Aggregate provisions (specific + standard + additional + Covid) / IRAC GNPA;
^ Net accretion = capital accreted – capital consumed during the quarter

Key Metrics for Q1FY25

Snapshot (As on June 30th, 2024) (in ` Crores)

Profit & Loss Absolute (in ` Crores) YOY Growth QOQ
  Q1FY25 Q1FY24 Q4FY24    
Net Interest Income 13,448 11,959 13,089 12% 3%
Fee Income 5,204 4,488 5,637 16% (8%)
Operating Expenses 9,125 8,232 9,319 11% (2%)
Operating Profit 10,106 8,814 10,536 15% (4%)
Core Operating Profit 9,637 8,295 9,515 16% 1%
Profit after Tax 6,035 5,797 7,130 4% (15%)
Balance Sheet Absolute (in ` Crores) YOY Growth
  Q1FY25  
Total Assets 14,68,163 13%
Net Advances 9,80,092 14%
Total Deposits 10,62,484 13%
Shareholders' Funds 1,57,766 20%


Key Ratios Absolute (in ` Crores)  
  Q1FY25 Q1FY24
Diluted EPS (Annualised in `) 77.79 75.40
Book Value per share (in `) 511 425
Standalone ROA (Annualised) 1.65% 1.80%
Standalone ROE (Annualised) 16.26% 19.17%
Cons ROA (Annualised) 1.70% 1.83%
Cons ROE (Annualised) 16.68% 19.44%
Gross NPA Ratio 1.54% 1.96%
Net NPA Ratio 0.34% 0.41%
Basel III Tier I CAR^ 14.52% 14.90%
Basel III Total CAR^ 16.65% 17.74%

^ including profit after tax for Q1

Deposits 13% YOY (a)   14% YOY (b)
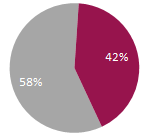
CASA

4% YOY (a) | 4% YOY (b)

(a) Month end balances (b) Quarterly average balance

Advances 14% YOY (c)   15% YOY (d)
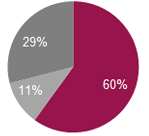
Retail
SME
Corporate

18% YOY | 20% YOY | 6% YOY (c) 10% YOY (d)

(c) Overall   (d) Overall (gross of IBPC sold)

Core Operating Profit (in ` Crores) 16% YOY
  • Q1FY25
    9,637
  • Q1FY24
    8,295
Profit After Tax (in ` Crores) 4% YOY
  • Q1FY25
    6,035
  • Q1FY24
    5,797


We have a very well distributed branch network;
added 50 branches in Q1 FY25

Domestic Branch Network*  
  • Jun-24
    5,427
  • Mar-24
    5,377
  • Mar-23
    4,903
  • Mar-22
    4,758
  • Mar-21
    4,594

* Includes extension counters

Performance at a Glance

Performance at a Glance

Steady core operating performance

  • Net Interest Income grew 12% YOY and 3% QOQ
  • Core operating revenue up 14% YOY | Core operating profit up 16% YOY

Loan growth delivered across focus business segment

  • Advances up 14% YOY and 2% QOQ, Retail loans grew 18% YOY
  • Small Business Banking loans grew 26% |2%, Mid-Corporate (MC) book grew 24% | 2% on YOY | QOQ basis
  • SBB + SME + MC mix at ₹2,09,985 crores | 21.42% of loans, up ~800 bps in last 4 years

MEB1 deposits grew 13% YOY; CASA ratio at 42%, which is amongst the best for peer private banks

  • On MEB basis, term deposits grew 20% YOY, CA grew 12% YOY, SA flat YOY
  • Average LCR2 during Q1FY25 was ~120%, outflow rates improved ~ 400 bps over last 2 years

Well capitalized with self-sustaining capital structure; adequate liquidity buffers

  • Overall capital adequacy ratio (CAR) stood at 16.65% with CET 1 ratio of 14.06%
  • `5,012 crores of other provisions, not considered for CAR calculation, provides additional cushion of ~40 bps over the reported CAR
  • Excess SLR of  `77,244 crores.

Continue to maintain strong position in Payments and Digital Banking

  • open by Axis Bank remains among the world’s top rated3 MB app on Google Play store and iOS app store with rating of 4.8; ~14 mn MAU4
  • open by Axis Bank & Axis Pay have ~11 mn non-Axis Bank customers
  • ~23.6 mn customers on WhatsApp banking
  • Credit card CIF market share at 14%, Retail Card spends grew 14% YOY

Asset quality stable, credit cost higher due to seasonality and lower recoveries and upgrades, not indicative of full year credit costs

  • PCR healthy at 78%; On an aggregated basis5, Coverage ratio at 150%
  • Gross slippage ratio6 at 1.97%, Net slippage ratio6 at 1.37%
  • Q1FY25 net credit cost6 at 0.97%

Key domestic subsidiaries7 continue to deliver steady performance

  • Q1FY25 profit at `436 crores up 47% YOY, with a return on investment in domestic subsidiaries of 54%
  • Axis Finance Q1FY25 PAT grew 26% YOY to `154 crores ; asset quality metrics improve, ROE at 14.7%
  • Axis AMC Q1FY25 PAT grew 27% YOY to `116 crore, Axis Securities Q1FY25 PAT grew 171% YOY to `121 crores
  • Axis Capital Q1FY25 PAT grew 220% YOY to `49 crores and executed 22 investment banking deals in Q1FY25

1 MEB – Month End Balance,
2 Liquidity Coverage Ratio
3 with 2.7 mn+ reviews
4 Monthly active users, engaging in financial and non-financial transactions,
5 (specific+ standard+ additional + COVID)
6 Annualized
7 Figures of subsidiaries are as per Indian GAAP, as used for consolidated financial statements of the Group