
Q2FY23 PAT at `5,330 crores, up 70% YOY driven by NII growth, NIM expansion, higher fees and flat QOQ operating expenses
Q2 FY23 Consolidated ROE (annualized) at 18.90%, up 545 bps YOY, with subsidiaries contributing 41 bps
1. SBB : Small Business Banking
2. Coverage Ratio = Aggregate provisions (specific + standard + additional + COVID) / IRAC GNPA
3. Month End Balances
4. Across 59 global banks, 8 global neo banks and 50 Indian fintech apps with 15 lakh+ reviews
QAB: Quarterly Average Balance
MAU: Monthly Active Users
* : Based on RBI data from Nov'21 to Aug'22

Snapshot (As on September 30th, 2022) (in ` Crores)
| Profit & Loss | Absolute (in ` Crores) | QOQ | YOY Growth | |||
|---|---|---|---|---|---|---|
| Q2FY23 | Q1FY23 | H1FY23 | Q2FY23 | Q2FY23 | H1FY23 | |
| Net Interest Income | 10,360 | 9,384 | 19,744 | 10% | 31% | 26% |
| Fee Income | 3,862 | 3,576 | 7,438 | 8% | 20% | 26% |
| Operating Expenses | 6,585 | 6,496 | 13,081 | 1% | 14% | 22% |
| Operating Profit2 | 7,716 | 5,887 | 13,603 | 31% | 30% | 12% |
| Net Profit | 5,330 | 4,125 | 9,455 | 29% | 70% | 79% |
| Balance Sheet | Absolute (in ` Crores) | YOY Growth | ||
|---|---|---|---|---|
| Q2FY23 | ||||
| Total Assets | 11,85,272 | 13% | ||
| Net Advances | 7,30,875 | 18% | ||
| Total Deposits^ | 8,10,807 | 10% | ||
| Shareholders' Funds | 1,24,564 | 16% | ||
^ period end balances
| Key Ratios | Absolute (in ` Crores) | |
|---|---|---|
| Q2FY23 / H1FY23 | Q2FY22 / H1FY22 | |
| Diluted EPS (Annualised in `) (Q2/H1) | 68.36 / 61.27 | 40.42 / 34.34 |
| Book Value per share (in `) | 405 | 349 |
| ROA (Annualised) (Q2/H1) | 1.80 / 1.62 | 1.19 / 1.03 |
| ROE (Annualised) (Q2/H1) | 18.49 / 16.80 | 12.72 / 10.92 |
| Gross NPA Ratio | 2.50% | 3.53% |
| Net NPA Ratio | 0.51% | 1.08% |
| Basel III Tier I CAR* | 15.75% | 17.54% |
| Basel III Total CAR* | 17.72% | 20.04% |
* including profit for H1FY23
 10% YOY
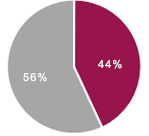
 CASA#
CASA#
13% YOY (QAB#) | 14% YOY (End Balance)
#QAB - Quarterly Average Balance
18% YOY 19% YOY1 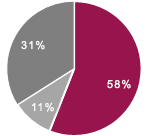 Retail
 SME
SME
 Corporate
22% YOY | 28% YOY | 7% YOY 11% YOY1
1 gross of loans sold under IBPC
30% YOY 43% YOY Core OP
OP
70% YOY


SStrong operating performance, net profit grew 70% YOY and 29% QOQ to `5,330 crores
Healthy loan growth delivered across focused business segments
Steady growth in granular deposits, early visibility of improving quality
Well capitalized with adequate liquidity buffers
Retaining strong position in Payments and Digital Banking
Declining NPA's and slippages, moderating credit costs, low restructured book
Bank's domestic subsidiaries continue to deliver steady performance; annualized profit4 at `1,170 crores
1 QAB – Quarterly Average Balance
2 Liquidity Coverage Ratio
3 (specific+ standard+ additional + COVID)
4 Figures of subsidiaries are as per Indian GAAP, as used for consolidated financial statements of the Group