Progress
Defined by Prudence
The value we create for our stakeholders is our prime indicator of success.
Financial parameters
Total Assets (` in crores)
14% 5 - year CAGR 19%  y-o-y
y-o-y
Total Advances (` in crores)
14% 5 - year CAGR 15%  y-o-y
y-o-y
Total Deposits (` in crores)
15% 5 - year CAGR 18%  y-o-y
y-o-y
Current Account and Savings Account (CASA)(` in crores)
12% 5 - year CAGR 16%  y-o-y
y-o-y
Net Interest Income (NII) and Net Interest Margin (NIM) (` in crores)
13% 5 - year CAGR 13%  y-o-y
y-o-y

Operating Revenue (`)
10% 5 - year CAGR 17%  y-o-y
y-o-y
Operating Profit (` in crores)
8% 5 - year CAGR 7%  y-o-y
y-o-y
Net Profit (` in crores)
29% 5 - year CAGR 98%  y-o-y
y-o-y
Earnings Per Share (Basic) (`)
Book Value Per Share (`)
10% 5 - year CAGR 13%  y-o-y
y-o-y
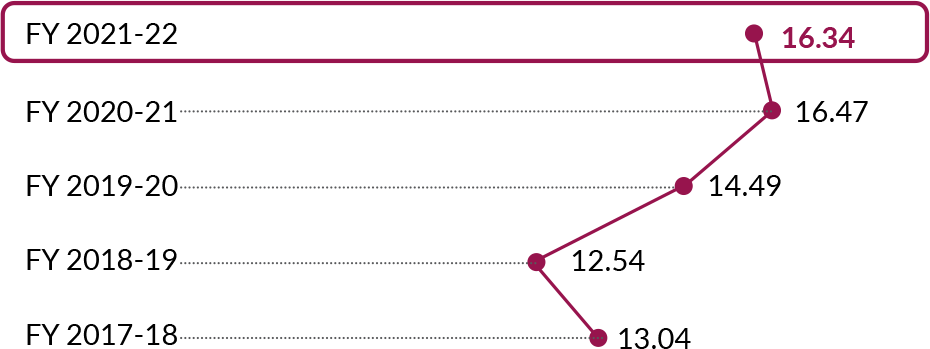
Return on Equity (RoE)(%)
Return on Assets (RoA)(%)
Provision coverage ratio(%)
Capital Adequacy Ratio(%)
Tier-I Capital Adequacy Ratio(%)
Highlights of Subsidiaries*
44%
Growth in PAT of Domestic Subsidiaries
20%
Growth in Axis Capital PAT
47%
Growth in Axis AMC PAT
72%
Growth in Axis Finance PAT
40%
Growth in Axis Securities PAT
*y-o-y growth
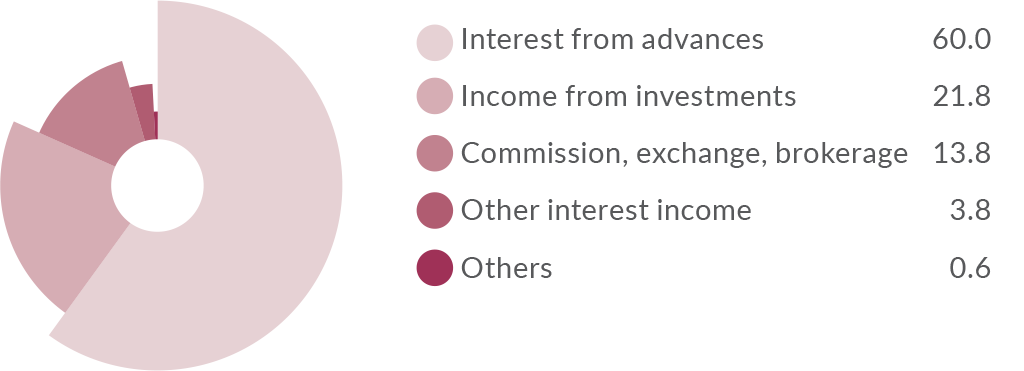
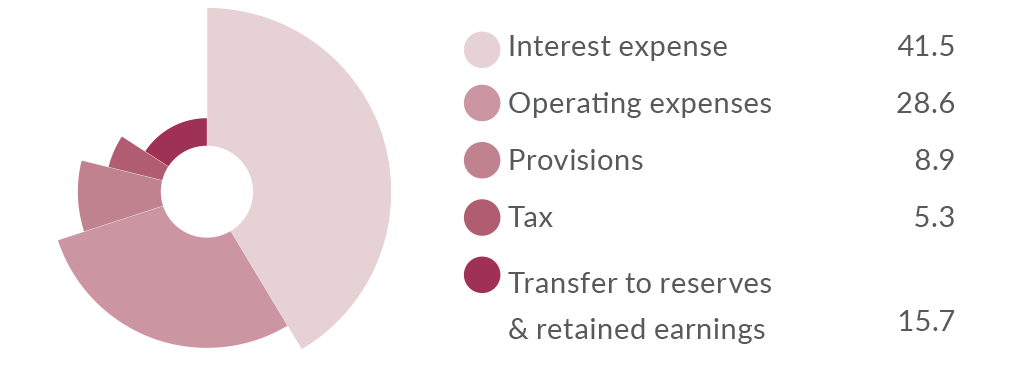
Rupee Earned and Rupee Spent (%)
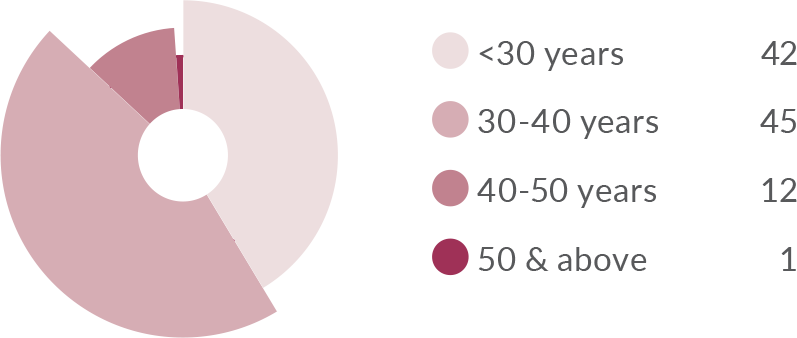
People
Average Person-hours of Training(%)
Community
Lives Impacted(No. in lakh)
Above are standalone figures as on/for year ended 31 March, 2022 unless otherwise mentioned
* including amount transferred to unspent CSR account `24.68 crores to be utilised towards ongoing projects/programmes


